4.2 Spectral indices
It has been said in the introduction that SED fitting can
only yield useful results if the models are as or more
precise than the effect on the data of the property to be
measured. Historically this was the case only for very
limited wavelength ranges in the optical. The solution to
this problem has then been to not fit the entire SED, but
to define indices, i.e. measure the equivalent widths, for
certain absorption features.
In the standard side-band method (Burstein
et al. 1984; Faber et al. 1985) a careful analysis leads to the
definition of one central and two side bands (a blue and a
red). The continuum compared to which the equivalent
width is measured is a linear interpolation between the
average fluxes found in these two sidebands. Much work
has gone into optimizing the set of available indices, as well
in terms of coverage, as well as in terms of model
precision (e.g. Rose 1984; Worthey et al. 1994; Trager
et al. 1998; Tripicco and Bell 1995; Cenarro
et al. 2002; Thomas, Maraston, and Korn 2004; Lee
et al. 2009b, and references therein).
We are still waiting for standard indices in other
wavelengths than the optical, though see Rix et al. (2004),
Keel (2006), Maraston et al. (2009), & Chavez
et al. (2009), and Lançon et al. (2008) & Cesetti
et al. (2009) for headway into the UV and NIR
respectively. These would make the index approach a true
multi-wavelength approach.
Rogers et al. (2010a) have attempted to improve on the
classical sideband definition by introducing a “boosted
median” method. The main feature of this method is
that for each side-band only the Lth percentile of the
distribution of fluxes is used to determine the flux within
the side-band. As this procedure automatically chooses
the largest fluxes in the side-band, it will define the
pseudo-continuum from those points that are least affected
by “secondary” absorption features, i.e. absorption
features that are not part of the central band. It thus
improves the robustness of the pseudo-continuum if the
spectral resolution is high enough to avoid blending of all
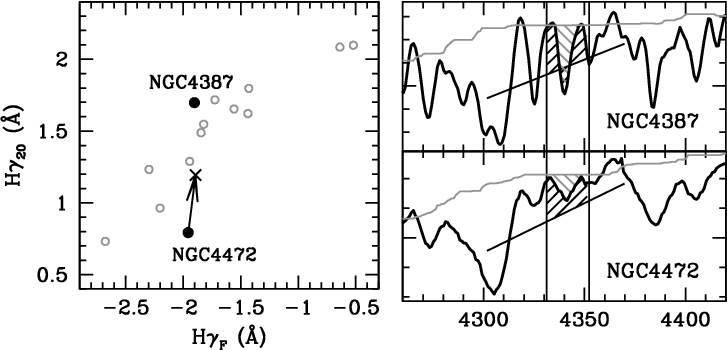
features. Figure 9 illustrates the difference between the
boosted median equivalent width and a standard side-band
method for a measurement of Hγ. The sample corresponds
to a set of 14 elliptical galaxies in the Virgo cluster
observed with a 2–2.4Å resolution (FWHM) and with high
S/N (Yamada et al. 2006).
Index fitting can be considered a special case of SED fitting (for a fitting code see e.g. Graves and
Schiavon 2008). It has the advantage of compressing the
information available in galaxy spectra into a set of discrete
numbers. Much of what is considered secure knowledge in
stellar element abundances and age of integrated stellar
populations is still largely based on fitting indices
(e.g. Trager et al. 2000; Kauffmann et al. 2003a; Thomas
et al. 2005; Gallazzi et al. 2008; Graves, Faber, and
Schiavon 2009, to cite only a few).
The clear disadvantage of absorption line indices is that
some of the information is lost. While indices have
been defined with great care to approach the ideal of
representing one element species, in practice many
small lines interfere in particular in the side-bands.
Spectral fitting (Section 4.4) can in principle use more
information but it places much higher requirements on
model accuracy.