4.3 Principal Component Analysis
Ideally we would like to represent a galaxy spectrum by
a small set of continuous parameters that uniquely
determine the best-fit spectrum. Principal Component
Analysis (PCA) is one algorithm commonly used to derive
an optimal set of linear components, diagonalising
the covariance matrix of the data points to find the
directions of greatest variation. Its representation of data
through a linear combination of independent (orthogonal)
components, or eigenvectors is thus an alternative method
to using a set of discrete SSP templates (Section 4.4).
Since the convolution with transmission curves is a linear
operation, these methods are as simple as solving a linear
equation, even for photometric datasets (Connolly
et al. 1999; Budavári et al. 2000).
PCA has been successfully applied to astronomical
spectral datasets, although not yet to photometric datasets
which suffer the additional complication of observed-to-rest
frame translation (Connolly et al. 1995b). The main
difficulty with PCA is that the interpretation of the
empirically determined PC components in terms of
physical properties is complex at best (though see Wild
et al. 2007, 2009; Rogers et al. 2007, 2010b). This is
exacerbated by its sensitivity to outliers and hence
out-of-the-box algorithms are of limited use for astronomical
datasets.
Recent work by Budavári et al. (2009b) solves the
problem of reliable eigenspectra determination by an
iterative procedure that is efficient to compute and
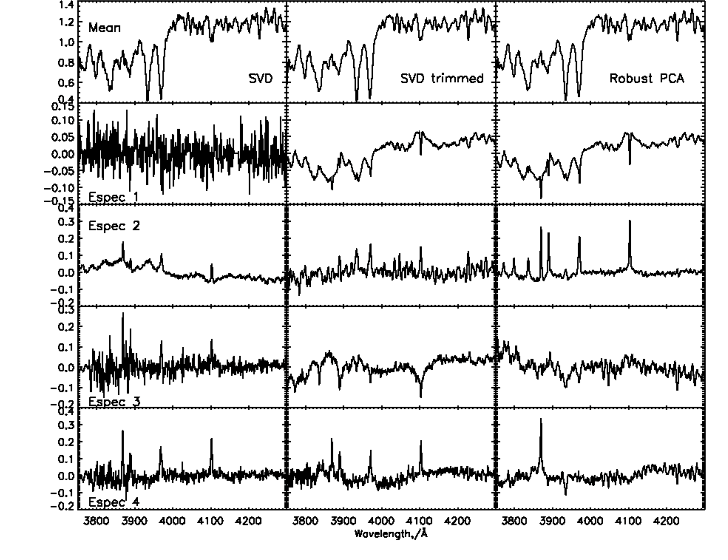
robust in the statistical sense. Figure 10 illustrates the
comparison of three PCA methods on the blue optical
region of 2000 randomly selected SDSS galaxy spectra.
Each column contains (from left to right) the results of the
classic PCA, classic PCA using iterative sigma clipping of
the dataset, and the new robust algorithm. What is
immediately striking in the robust case is the following: (a)
The very clean appearance of the nebular emission lines in
the second eigenspectrum. (b) These are correlated with
the weaker Balmer absorption (seen as broad wings on the
narrow emission lines) and rise in the blue from the
continua of O and B stars which are the dominant source
of ionisation of the nebular emission lines. (c) The emission
line in the 4th eigenspectrum is the only one in this
wavelength range which is not a Balmer line, and with
a higher ionisation state is sometimes attributed to
the presence of an AGN. Without any prior physical
knowledge, the robust PCA has separated out a line
which is physically distinct from the others, and tied
together HII emission lines with the O and B stars that
excite them. The results are clearly of more use for
characterising the galaxy population than traditional PCA
algorithms. The robust PCA algorithm provides a new,
fast and easy to use method for the investigation of real astronomical datasets in a model independent
manner.