6.2 Dust
Dust cannot be ignored when fitting a galaxy’s SED, as
shown by the cosmic infrared background, which has
comparable power to the distinct peak of the cosmic
UV-optical background (Hauser and Dwek 2001).
The relative strength of the cosmic background in
the infrared suggests a significant processing of the
galactic stellar light over the age of the universe. This
processing must have also been more significant with
increasing redshift as the percentage of stellar light
re-radiated by dust is only ~ 30% locally (Popescu and
Tuffs 2002), as supported by the increasing number
density of luminous IR galaxies up to z ~ 1.3 (Magnelli
et al. 2009).
As discussed in section 2, the absorption and emission of
light by dust are generally treated as separate processes in
modelling, and this is similarly true in SED fitting.
6.2.1 Attenuation by Dust
Dust between the observer and the individual stars of a
galaxy acts to extinguish and redden the light from those
stars. When the stars in our own Galaxy were examined it
was found that a simple relation with wavelength was
able to describe the extinction and reddening by dust
for a wide range of galactic environments, with the
only strong feature occurring at ~2175Å (Cardelli,
Clayton, and Mathis 1989). A similar but steeper
extinction law was found for the Magellanic Clouds, with
weaker or non-existent feature at 2175Å (Gordon and
Clayton 1998; Misselt, Clayton, and Gordon 1999). It
is these extinction laws that have given rise to the
contemporary model of dust in the ISM (i.e. Mathis,
Rumpl, and Nordsieck 1977), and the understanding that
the dust composition between the Milky Way and
Magellanic clouds is different.
Yet when integrated over the whole of a galaxy the
situation becomes complex, with the geometry of the stars
and dust strongly affecting the resulting spectrum.
The effects of varying amounts of extinction of the
different stellar populations due to the spatial distribution
of stars and clumpy dust, and the scattering of blue
stellar light into our line of sight act to flatten the
effects of dust on the spectrum, creating an attenuation
law, where the amount of reddening with extinction
is less (or ‘greyer’) than we observe locally (Witt, Thronson, and Capuano 1992). This was exactly what was
found in starburst galaxies by Calzetti, Kinney, and
Storchi-Bergmann (1994), and Charlot and Fall (2000)
found that a simple screen effective attenuation (i.e. a
screen of dust between the galaxy and observer) with a
power-law relation, τISM ∝ λ-0.7, was able to account
reasonably well for the diffuse ISM attenuation in galaxy
observations. It is this complexity that makes disentangling
the effects of geometry and differing dust difficult, and thus
the extraction of physical dust properties from galaxy
SEDs problematic. There are two areas where some
progress has been made.
The 2175Å feature
The 2175Å feature has been associated with small
carbonaceous grains in the ISM (Mathis, Rumpl, and
Nordsieck 1977), and is observed in both the Milky way,
M33 (Gordon et al. 1999), and (weakly) in the LMC, but
is almost non-existent in the SMC. This feature is not
observed in the attenuation law of starburst galaxies
(Calzetti, Kinney, and Storchi-Bergmann 1994). Whether
this lack is due to the clumpy geometry of dust and stars
(Fischera, Dopita, and Sutherland 2003) or is actually
indicative of SMC-like dust in starburst galaxies (Gordon
et al. 1999) is still under debate, yet this feature is
generally not needed to fit the attenuation of galaxies. In
QSOs, which, being dominated by a nuclear source, are
closer to the galactic extinction situation, an average
attenuation curve does not show this feature, suggesting
processing of the ISM in these active objects (Czerny
et al. 2004). However, in a few non-local galaxies where
direct extinction lines of sight are available, this feature
has been observed, suggesting it may be more common
than the attenuation curves of local galaxies suggest
(Wang et al. 2004; Elíasdóttir et al. 2009). At higher
redshifts, where UV spectra are more commonly observed,
recent studies find evidence for the existence of the
2175Å bump (e.g. Noll et al. 2007; Noterdaeme
et al. 2009).
Young versus old attenuation
One important progress made in the treatment of
galaxy attenuation is the realisation that the effective
attenuation of a galaxy is dependent upon its star
formation history. Calzetti (1997) found that in starburst
galaxies the effective attenuation of the stellar continuum
was less than that suffered by the nebula emission, as
measured through emission lines. This clear indication of
the clumpiness of the dust in galaxies has been interpreted
as an indication of differential attenuation of different
stellar populations, with young stars, and their associated
ionized nebula, strongly attenuated by the clouds from
which the stars formed, while older stars have evolved out
of their ‘birth clouds’ either through cloud or stellar
dispersion, and are only attenuated by the diffuse ISM
dust, which acts on both the young and old stars (see
e.g. Charlot and Fall 2000). Exactly what is the clearing
time of these clouds and the differential attenuation is still
uncertain, and may be galaxy specific, but this forms a
basis for current galaxy SED models as discussed in section
2.
6.2.2 Dust Emission
Extracting physical properties from dust emission in the
IR is difficult for both theoretical and observational
reasons: excluding the mid-IR, there are no observed dust
features, most being washed out due to the broad shape of
the blackbody emission; the IR suffers from strong
observational constraints, with most data coming from
space- and balloon-based observations; associated with this
is the, until recently, limited sensitivity and spatial
resolution and in the far-IR, at wavelengths > 100μm, the
sparsity of data.
With ISO and, especially, Spitzer space telescopes this
situation has recently improved, and will improve more so
in the near future with the recent launch of Herschel and
ALMA beginning to take form. So we touch upon here
some of the galaxy physical properties that have been
determined from the dust IR emission.
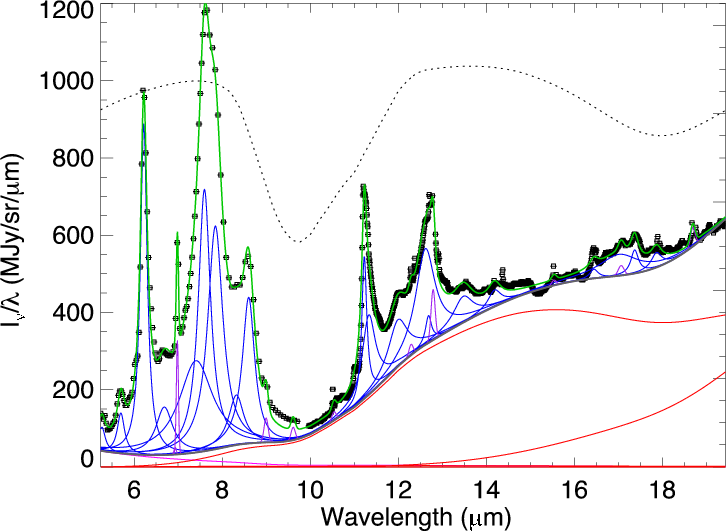
PAH emission in the Mid-IR
As mentioned in section 2, the 5-20μm mid-infrared
spectrum of galaxies is generally dominated by broad
emission features arising from large molecules, polycyclic
aromatic hydrocarbons (see e.g. Smith et al. 2007).
Underlying these features is the stellar continuum at short
wavelengths and hot dust emission. Confusing the
interpretation of the emission features are strong ionic
emission lines arising from species such as Ne+ and Ne++
and strong, broad absorption features from silicate grains
at 9.8μm and 18μm.
A recent tool, PAHFIT, has been developed to
decompose the mid-infrared spectra into its stellar, PAH,
dust continuum, and line emission constituents, using
functional forms and templates for the features in this
wavelength range (Smith et al. 2007). An example of this
can be seen in figure 25. The PAH feature luminosity has
been used as star formation rate tracers (see section
6.2.4), and the relative strength of these features to the
continuum have been found to be strongly linked to the
presence of AGN (see e.g. Spoon et al. 2007, and below), and to the gas phase metallicity (see e.g. Smith
et al. 2007). The relative strengths of these features can
also be used to diagnose the mean size and ionization
state of the PAHs, which is related to the average
radiation field and dust size distribution (Draine and
Li 2007a).
Diagnosing the energy source in ULIRGs
Due to the high obscuration by dust in IR bright
galaxies, especially ultra luminous IR galaxies (ULIRGs),
diagnosing the dominant heating source is problematic.
The diagram put forward by Spoon et al. (2007) helps
resolve this issue by using the strength of the strong
silicate absorption feature that is determined from fitting
the mid-IR SED (as discussed above in Section 6.2.2)
in association with the equivalent width of the PAH
features. This diagram cleanly separates different classes
of ULIRGs, from obvious Seyfert galaxies, strongly
starbursting galaxies, and to deeply buried AGN ULIRGs
and represents one of the strengths of IR SED fitting,
extracting information from objects which are heavily
obscured at shorter wavelengths.
Dust masses
One of the more important properties obtained by
fitting the IR SED is the dust mass. Through fitting of
the far-IR SED the temperature(s) and the relative
contributions of the different dust components that make
up the SED can be constrained. Then, using knowledge of
the emissivity per unit mass of dust, the total dust mass
(Md ) can be determined, using an equation such as (based
on Dunne and Eales 2001);
![[∑ ]
Md=--L850- ---Nk---- ,
κd(850) k B(850,Tk)](walcher_ms36x.png) | (5) |
with L850 the 850μm luminosity, and Nk and Tk the
relative contribution and temperature of dust component
k. The sum of dust components is usually limited (≤ 3) by
the sparse observational points at long wavelengths, but
can also be represented by an integral of temperatures,
parametrized by the strength of the heating radiation field
(such as used by, e.g. Dale and Helou 2002; Draine and
Li 2007a). κd (850) is the dust mass opacity coefficient,
taken to be 0.077 m2kg-1 by Dunne et al. (2000); Dunne
and Eales (2001), an intermediate value between graphite
and silicate. It is generally with this parameter that most of the uncertainties in determining dust masses
remain.
Longer wavelength fluxes (> 300μm, such as 850μm) are
preferable to shorter wavelengths when determining dust
masses as these sample the Rayleigh-Jeans part of
the Planck curve, where the flux is least sensitive to
temperature. Longer wavelengths are also more sensitive to
the mass of the emitting material, as they are sensitive to
cold dust as well as warm.
Clear examples of fitting the far IR SED using simple,
emissivity-modified black-bodies and determining the total
dust masses can be found in Dunne et al. (2000),Dunne
and Eales (2001) and more recently in Clements, Dunne,
and Eales (2009) (see also da Cunha et al. 2010, Section
6.3 below). These works detail nicely the pertinent issues
with both the data and fitting the far-IR SEDs. One of the
best examples of determining the total dust mass, as well
as other parameters, using the full IR SED was done by
Draine et al. (2007b). Their physically based SED models
(described in detail in Draine et al. 2007b) were fitted to
the far-IR SEDs of galaxies from the SINGS sample, and
gave determinations of the total dust mass, PAH fraction
and information on the interstellar radiation field heating
the dust. They found that dust in spiral galaxies resembled
that found in the local Milky Way ISM, with similar
dust-to-gas ratios, and that generally it is the diffuse ISM
that dominates the total IR power, excluding strong
starbursting systems. These results thus confirmed the
earlier ISO discoveries (see the review by Sauvage, Tuffs,
and Popescu 2005). Note also that even earlier detailed
radiative transfer modelling of individual galaxies had
pointed to the dominance of the diffuse component
(Popescu et al. 2000).
Sub-mm excess emission
SED fitting can not only return physical properties, but
can also indicate where our current knowledge is failing. As
mentioned above, the long wavelength dust emission is a
good handle for the total dust mass. However, when fitting
the IR SED of several dwarf galaxies it has been found
that the sub-mm flux is in excess to a standard cool
dust-body emission, requiring additional dust components
at a unreasonably low temperatures ( 7 K) to fit the SED
(Lisenfeld et al. 2002; Israel et al. 2010, e.g.). While
very cold large grains could be one possible cause,
other suggestions have included small stochastic grains
that spend most of their time at cold temperatures
(Lisenfeld et al. 2002), rotating dust grains (Israel
et al. 2010), or some modification of the dust emissivity
at these wavelengths or temperatures (Draine and
Lee 1984; Weingartner and Draine 2001). Either way
until this issue is resolved on the cause of this excess, the
dust mass of these dwarf galaxies such as NGC 1569 will
have large uncertainties. It is hoped that telescopes such as
Herschel and ALMA may find more of these objects in
the near future and help find the cause of this excess
emission.
7 K) to fit the SED
(Lisenfeld et al. 2002; Israel et al. 2010, e.g.). While
very cold large grains could be one possible cause,
other suggestions have included small stochastic grains
that spend most of their time at cold temperatures
(Lisenfeld et al. 2002), rotating dust grains (Israel
et al. 2010), or some modification of the dust emissivity
at these wavelengths or temperatures (Draine and
Lee 1984; Weingartner and Draine 2001). Either way
until this issue is resolved on the cause of this excess, the
dust mass of these dwarf galaxies such as NGC 1569 will
have large uncertainties. It is hoped that telescopes such as
Herschel and ALMA may find more of these objects in
the near future and help find the cause of this excess
emission.
6.2.3 Dust in the UV to IR
The infrared-to-ultraviolet ratio is a coarse measure of dust
extinction in the ultraviolet, and thus should be related to
the amount of reddening in ultraviolet spectra. Indeed,
starbursting galaxies follow a tight correlation between the
ratio of infrared-to-ultraviolet emission and the ultraviolet
spectral slope (e.g. Calzetti 1997; Meurer, Heckman, and
Calzetti 1999). Compared to the relation defined by
starbursts, normal star-forming galaxies are offset
to redder ultraviolet spectral slopes, exhibit lower
infrared-to-ultraviolet ratios, and show significantly larger
scatter (Kong et al. 2004; Buat et al. 2005; Burgarella,
Buat, and Iglesias-Páramo 2005; Seibert et al. 2005; Cortese
et al. 2006; Boissier et al. 2007; Gil de Paz et al. 2007; Dale
et al. 2007). Offsets from the locus formed by starbursting
and normal star-forming galaxies can be particularly
pronounced for systems lacking significant current star
formation, such as elliptical galaxies, systems for which the
luminosity is more dominated by a passively evolving
older, redder stellar population.
Using a sample of 1000 galaxies with spectroscopy from
the SDSS and homogeneous photometric coverage from the
UV to 24μm from SDSS and the Galex and Spitzer
satellites, Johnson et al. (2007a) found that the sample
galaxies span a plane in the three-dimensional space of
NUV-3.6μm colour, Dn(4000) index (as defined by Balogh
et al. 1999), and infrared excess, IRX (=LIR/LFUV ). The
three-dimensional relation can be expressed in terms
of empirical functions, where IRX is a function of
NUV-3.6μm (or more weakly with other colours) and
Dn (4000). They suggest that this relation can be explained
primarily through SFH and dust attenuation, with both
acting to steepen the optical-UV slope (as measured by the
NUV-3.6μm color), but only attenuation increasing the IR
flux and hence IRX (Johnson et al. 2006).
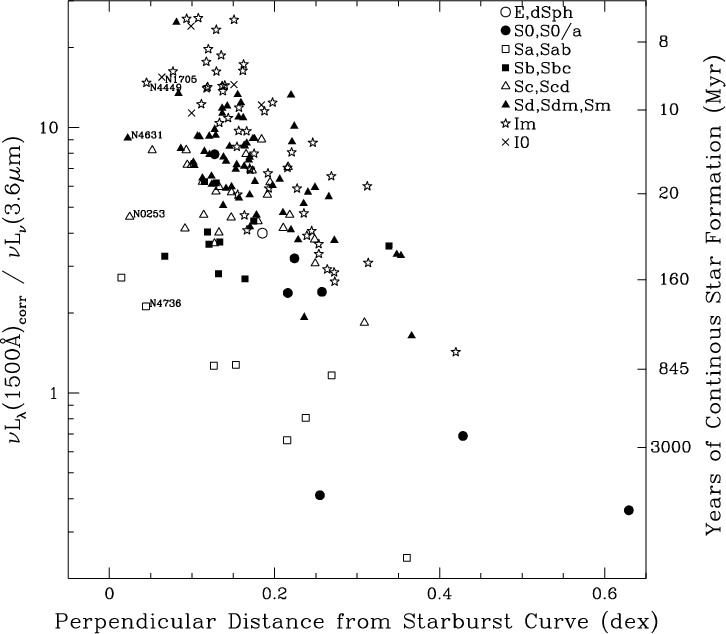
A similar analysis was presented at the workshop by D.
Dale using the LVL survey (see Section 3.3.1), which consists
of a statistically complete set of star-forming galaxies,
nearly two-thirds of which are dwarf/irregular systems.
Figure 26 shows the ratio of far-ultraviolet-to-near-infrared
luminosity as a function of the (perpendicular) distance
from the starburst curve (e.g. Calzetti 1997; Meurer,
Heckman, and Calzetti 1999) for the LVL galaxies,
with the far-ultraviolet emission is corrected for
attenuation using the infrared-to-ultraviolet-based recipe formulated in Buat et al. (2005). By correcting
for dust, the FUV/3.6 μm ratio measures only the
ratio of past-to-present star formation, sometimes
referred to as the birthrate parameter (see also, for
example, Boselli et al. 2001; Cortese et al. 2006).
This ratio represents the birthrate parameter since the
far-ultraviolet traces star formation over 100 Myr
timescales whereas the near-infrared probes the total
stellar mass built up over much longer timescales. This
plot is as such a compression of the plane discussed by
Johnson et al. (2007a), and shows a clear trend, with
lower birthrate systems exhibiting larger distances from
the starburst trend, consistent with the study of Kong
et al. (2004). To further quantify this, theoretical models
with solar metallicity, 1 M⊙ yr-1 continuous star
formation curves assuming a double power law initial mass
function, with α1,IMF = 1.3 for 0.1 < m∕M⊙ < 0.5
and α2,IMF = 2.3 for 0.5 < m∕M⊙ < 100 were run
(Vázquez and Leitherer 2005) and were matched with
their determined FUV/3.6 μm ratio on the right axis,
demonstrating that those with the oldest SFH (i.e. lowest
birthrate parameters) lie furthest from the theoretical
starburst curve.
6.2.4 Star Formation Rate from the IR
One of the most commonly extracted galaxy properties
from the IR is the star formation rate. As discussed above,
recently formed stellar populations tend to be more
obscured than older stellar populations. They are also
more luminous and emit more in the ultraviolet where dust
opacity peaks, and thus dust emission is in principle a
good tracer of recent star formation, assuming a simple
calorimetric situation. It is these assumptions that lead to
the widely-used Kennicutt (1998) relation between
total IR luminosity (8–1000μm) and star formation
rate.
Of course the situation is more complex than this, as
discussed in the same work. A range of ages contribute to
dust heating (Kennicutt et al. 2009), and star forming
regions in galaxies suffer a range of obscurations, from
totally obscured (ULIRGs) to unobscured (blue compact
dwarfs). It is for this reason that this relation has been
re-examined and empirically calibrated with new data from
Spitzer. In general, all recent studies have found that the
IR can be used as a SFR indicator, albeit without a direct
one-to-one connection. Complications arise due to the
correlation of SFR, luminosity, and galaxy gas and dust
masses, and possible non-linearities due to metallicity
effects (Wu et al. 2005).
More specifically, Calzetti et al. (2007) using spatially
resolved observations, found strong correlations between
the 24μm and Pα luminosity densities (a proxy for SFR,
assuming little attenuation in the near-IR), and a
correlation between the 8μm and Pα luminosity densities,
though this failed at low metallicities. Using these, they
were able to create new calibrations for SFR versus 24
μm luminosity, and SFR versus 24 μm and observed Hα
luminosities, with the latter relation accounting better
for the escaping radiation not accounted for by the
dust emission. Rieke et al. (2009) took this further,
showing that for higher IR luminosity objects, Pα was no
longer a good tracer for SFR as even it was obscured,
and gave their own calibrations for SFR with the IR
luminosities.
On galactic scales, Zhu et al. (2008) showed with a
larger galaxy sample from SWIRE that the Calzetti
et al. (2007) relations between 24μm luminosity and
extinction corrected Hα luminosity hold, and thus
L(24μm ) is a good SFR indicator. In addition they also
showed that 24μm is well correlated with 70μm and total
IR luminosities, indicating that these too can be used as
SFR indicators, albeit with larger scatter.
The 8μm (and other PAH bands) and longer wavelength
observations, such as the Spitzer 160 μm band, are observed to be correlated with each other (Bendo
et al. 2008), and are thought to be more associated with
the cooler diffuse ISM. While the diffuse ISM is heated by
the radiation from star forming regions, it is also heated by
the diffuse radiation field from older stars, meaning that
these bands are not as strong SFR traces, especially at low
SFRs.