4.6 Method-independent caveats
A good example of how the quality of the available models
and data influence the use of tracers and the precision with
which physical properties can be recovered is given
by recent developments in the use of index fitting.
Historically, early-type galaxies have been analyzed using
simple stellar populations models as templates, effectively
using the prior assumption that early-type galaxies were
created in one single burst of star formation. However,
detailed spectroscopic studies (Trager et al. 2000)
as well as near-ultraviolet photometry of early-type
galaxies (Ferreras and Silk 2000; Yi et al. 2005; Kaviraj
et al. 2007) have confirmed the presence of hot stars in
early-type galaxies.
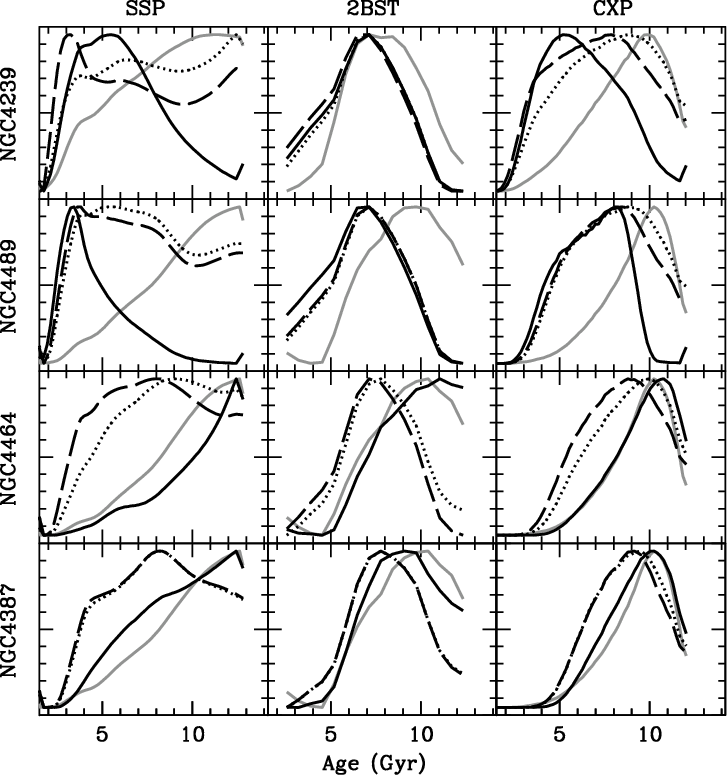
Figure 15 illustrates that it is now possible and
necessary to go beyond SSPs for early-types (see also
e.g. Serra and Trager 2007). The marginalized age
distribution is shown for four galaxies corresponding to
three different models (from left to right): Simple Stellar
Populations (SSP), a 2-burst model consisting of a
superposition of an old and a young SSP (2BST), and a
composite model assuming an exponentially decaying star
formation rate, including a simple prescription for chemical
enrichment (CXP). All these models combine the population
synthesis models of Bruzual and Charlot (2003). The
figure shows that SSPs give mutually inconsistent age
distributions, whereas composite models such as 2BST
or CXP give a more consistent picture. Notice how
lower mass galaxies such as NGC 4489 or NGC 4239
(top panels) give better fits for a 2 burst scenario,
whereas higher mass galaxies (NGC 4464, NGC 4387;
bottom panels) are better fit by a smooth star formation
history.
A similar analysis is presented in Trager and
Somerville (2009), who analyze mock data from
semi-analytic models in standard ways, in particular
computing the “SSP-equivalent” ages and metallicities.
They quantify that the SSP-equivalent age is poorly
correlated with the mass-weighted or light-weighted
average ages. The SSP-ages tend to be younger, biased to
the star formation in the last 0.1-2 Gyr. This has in
particular the effect of exaggerating the signature of
downsizing. On the other hand, the SSP-equivalent
metallicity is mostly equivalent to the light-weighted
metallicity. This serves as an important reminder, that the
prior assumption that one puts into the analysis are
very important for the resulting measurement. In the
case of using SSP-equivalent ages, the assumption,
or prior, is that galaxies are single-age entities. This
inevitably leads to important biases in the determined
parameters.
Among the important caveats of SED fitting, the
issue of the age-metallicity degeneracy cannot remain
unmentioned. This degeneracy is particularly important in
the optical. In a nutshell, age effects on colors or line
strengths can be mimicked by a change in metallicity. This
is especially important in the old populations found in
early-type galaxies. Equally important and generally
well-understood are the effects of using the optical SED
only to determine the attenuation. Basically this is a very
difficult undertaking and under almost any circumstance,
measurements of the Balmer decrement, the FIR emission
or the UV slope are essential to a reliable determination of
the attenuation.
In principle it should be possible and informative to
combine information from the photometric SED and spectral
information (Gallazzi and Bell 2009; Lamareille 2009).
While widespread use of this combination is hampered by
possible systematic differences in the results (e.g. Wolf
et al. 2007; Schombert and Rakos 2009), general
agreement between both types of information has been
claimed at least for stellar masses (Drory, Bender, and
Hopp 2004). Brinchmann et al. (Talk at workshop)
showed the results of a systematic comparison between
photometric and spectral SED fitting. Comparing formal
errors, they find no significant systematic offset. However,
for actively star forming galaxies it might be better to
use multiwavelength, broad-band photometry than
the detailed spectrum information. The reason is, as
mentioned in Section 4.4.3, that very young stars tend to
“hide” in the normalized optical part of the spectrum,
however they are readily visible as blue continuum in the
multi-wavelength SED. On the other hand, spectra are
better at picking up recent bursts through their Balmer
lines (e.g. Wild et al. 2007, 2009). Emission lines are a potential problem for fitting photometric SEDs. A
quick back of the envelope calculation, however, shows
that they produce a maximal offset in r-i colour of
0.1 at an equivalent width of 100 Å. Thus, ELs are a
minor issue in the broad-band colours when a full SED
is available and of limited concern for normal z~0
galaxies.
Galaxies with significant redshifts can in principle be
treated the same way as local ones, subject to two main
caveats though: (1) we currently do not have the same kind
of information available for large samples of galaxies at
redshifts above 1 as for local galaxies. (2) Galaxies at high
redshifts may have been significantly different from todays
galaxies, e.g. concerning their typical star formation
histories, their metallicities or their gas content. As local
analogs are rare or lacking, SED models are less well
calibrated and may be subject to considerable systematic
uncertainties. These need to be explored in detail, which is
currently only possible through semi-analytic models (see
e.g. Schurer et al. 2009). The design limits of SED
fitting codes should thus be kept in mind when quoting
results and – in particular – errorbars on high redshift
properties.